Instructor-led live Grafana training courses, whether delivered online or onsite, demonstrate through interactive, hands-on practice how to effectively use Grafana for monitoring and visualizing data.
Grafana training is available as "online live training" or "onsite live training". Online live training (also known as "remote live training") is conducted via an interactive, remote desktop. Onsite live training can be delivered locally on customer premises in Nantes or at NobleProg's corporate training centers in Nantes.
NobleProg -- Your Local Training Provider
Nantes, Zenith
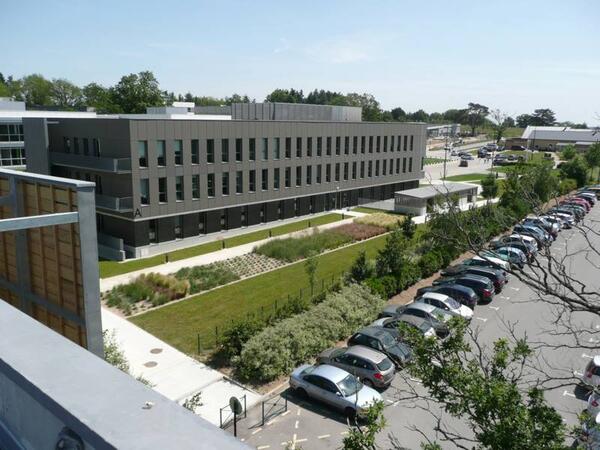
NobleProg Nantes, 4 rue Edith Piaf, Saint-Herblain, france, 44821
In the Parc d'Ar Mor zone, near the Zénith.
Car : from the ring road, Porte de Chézine Exit> Boulevard du Zenith > Esplanade Georges Brassens (restaurants) > Rue Edith Piaf on the right. From the N444 road (Nantes > Lorient), Exit #1 > boulevard Marcel Paul > Rue Edith Piaf at the right.
Parking Zénith P1 (free). Once parked, you can recognize the building: it's one of the tree bulding with zinc frontage.
Bicycle: free indoor parking
Public transport :
Tramway R1, Schoelcher station + 10 mn by foot through commercial center Atlantis
Tramway R1, François Mitterrand stop + bus 50, stop at Saulzaie station or bus 71, stop at the Zénith station
Tramway R3, Marcel Paul station + bus 50, Saulzaie station
Chronobus C6, Hermeland station+ bus 71, Zénith station
Bus : lignes 50 (Saulzaie station) or 71 (Zénith station)
Grafana and Prometheus are industry-standard tools used to monitor, visualize, and alert on IT infrastructure and application metrics through real-time dashboards and integrations.
This instructor-led, live training (online or onsite) is aimed at intermediate-level to advanced-level IT professionals who wish to integrate Grafana with Prometheus and multiple data sources, and build actionable visualizations and alerts across distributed systems.
By the end of this training, participants will be able to:
Install and configure Grafana and Prometheus in production-ready setups.
Integrate multiple data sources including SQL, Elasticsearch, InfluxDB, and cloud APIs.
Create advanced dashboards with variables, templating, transformations, and alerts.
Apply best practices in data modeling, performance tuning, and user access control.
Format of the Course also allows for the evaluation of participants.
Interactive lecture and discussion.
Lots of exercises and practice.
Hands-on implementation in a live-lab environment.
Course Customization Options
To request a customized training for this course, please contact us to arrange.
This instructor-led, live training in Nantes (online or onsite) is aimed at intermediate-level Grafana users who wish to build interactive, drill-down dashboards with dynamic thresholds and contextual updates.
By the end of this training, participants will be able to:
Create dashboards that respond to user interactions, such as clicking a graph bar
Implement visual drill-downs that update in-place (without new tabs)
Configure pie charts and detailed panels based on selection filters
Use dynamic thresholds that react to user input and real-time data
This instructor-led live training in Nantes (online or onsite) targets intermediate-level system administrators and monitoring professionals aiming to effectively utilize Grafana for establishing monitoring solutions, managing dashboards, and generating alerts.
Upon completion of this training, participants will be capable of:
Distinguishing between observability and monitoring.
Installing and configuring the Grafana server.
Configuring and connecting diverse data sources including Prometheus, InfluxDB, and ElasticSearch.
Creating, managing, and customizing dashboards and charts.
Utilizing variables and queries to build dynamic dashboards.
Setting up notifications and alerts via Grafana.
Installing and managing plugins to enhance Grafana’s capabilities.
This instructor-led, live training in Nantes (online or onsite) is aimed at advanced-level DevOps engineers and SREs who wish to manage and scale Prometheus and Grafana for large environments effectively.
By the end of this training, participants will be able to:
Architect Prometheus and Grafana for large-scale and distributed environments.
Optimize Prometheus performance for high-traffic systems.
Configure Grafana for large datasets and complex visualizations.
Implement advanced troubleshooting and scalability strategies.
This instructor-led, live training in Nantes (online or onsite) is aimed at intermediate-level developers and DevOps engineers who wish to instrument their applications to export and monitor custom metrics effectively using Prometheus and Grafana.
By the end of this training, participants will be able to:
Understand the importance of custom metrics for application monitoring.
Instrument applications to export custom metrics for Prometheus.
Create and configure dashboards in Grafana to visualize custom metrics.
Apply best practices for integrating monitoring into the development lifecycle.
This instructor-led, live training in Nantes (online or onsite) is aimed at advanced-level Kubernetes administrators and DevOps engineers who wish to enhance their monitoring skills for Kubernetes clusters using Prometheus and Grafana.
By the end of this training, participants will be able to:
Set up Prometheus and Grafana for Kubernetes monitoring.
Monitor key metrics for pods, nodes, and services.
Create dynamic dashboards to visualize cluster health and performance.
Implement alerting strategies for proactive issue resolution.
Apply best practices for scaling monitoring solutions in Kubernetes environments.
This instructor-led, live training in Nantes (online or onsite) is aimed at advanced-level DevOps and SRE professionals who wish to enhance their alerting and automation skills with Grafana and Prometheus.
By the end of this training, participants will be able to:
Create and manage advanced alerting rules in Prometheus.
Integrate Prometheus Alertmanager with external tools using webhooks.
Automate responses to alerts for faster issue resolution.
Use Grafana to visualize and manage alerts effectively.
This instructor-led, live training in Nantes (online or onsite) is designed for intermediate-level cloud and DevOps engineers aiming to enhance cloud observability using Grafana and Prometheus.
Upon completion of this training, participants will be able to:
Understand the benefits of integrating Grafana and Prometheus with cloud platforms.
Set up Prometheus for monitoring cloud-based resources.
Configure Grafana for visualizing cloud service metrics.
Leverage cloud-native tools and integrations for monitoring scalability.
This instructor-led live training in Nantes (online or on-site) is designed for intermediate-level DevOps and SRE professionals looking to create impactful dashboards and optimize their monitoring practices using Grafana and Prometheus.
By the end of this training, participants will be able to:
Understand best practices for designing effective dashboards.
Create and configure advanced Grafana dashboard elements.
Leverage Grafana templating for dynamic and reusable dashboards.
Implement alerting mechanisms to enhance operational awareness.
This instructor-led, live training in Nantes (online or onsite) is tailored for beginner-level system administrators and DevOps engineers who wish to develop core monitoring skills using Grafana and Prometheus.
By the end of this training, participants will be able to:
Understand the purpose and importance of monitoring in IT environments.
Install and configure Grafana and Prometheus for basic monitoring tasks.
Create simple dashboards and alerts to visualize system performance.
Apply best practices for monitoring system availability and performance.
This instructor-led, live training in Nantes (online or onsite) is aimed at beginner-level IT professionals and DevOps practitioners who wish to learn the basics of Grafana and Prometheus.
By the end of this training, participants will be able to:
Understand the purpose and key features of Grafana and Prometheus.
Install and configure Grafana and Prometheus on a Linux environment.
Set up basic data sources and dashboards in Grafana.
Monitor system metrics and visualize data using Prometheus.
This instructor-led live training in Nantes (online or onsite) is designed for intermediate-level data analysts who wish to learn and utilize the advanced features and components of Grafana for data visualization and analysis.
By the end of this training, participants will be able to:
Gain an in-depth understanding of advanced Grafana concepts and components.
Leverage template variables and dynamic dashboards for enhanced data visualization.
Use Grafana Query Language for complex queries.
Learn best practices for scaling Grafana, optimizing performance, and ensuring high availability.
Online Grafana training in Nantes, Grafana training courses in Nantes, Weekend Grafana courses in Nantes, Evening Grafana training in Nantes, Grafana instructor-led in Nantes, Evening Grafana courses in Nantes, Grafana private courses in Nantes, Grafana on-site in Nantes, Grafana classes in Nantes, Grafana one on one training in Nantes, Grafana boot camp in Nantes, Grafana instructor-led in Nantes, Grafana coaching in Nantes, Grafana instructor in Nantes, Weekend Grafana training in Nantes, Online Grafana training in Nantes, Grafana trainer in Nantes