Whether delivered online or onsite, our instructor-led live Statistics courses utilize interactive discussions and practical exercises to demonstrate how statistical principles are applied to resolve real-world challenges.
These Statistics training programs are available as "online live training" or "onsite live training". Online live training (also referred to as "remote live training") is facilitated through an interactive remote desktop. Onsite live training can be provided at customer locations in Lyon or within NobleProg's corporate training centers in Lyon.
NobleProg -- Your Local Training Provider
Lyon, Swisslife Tower
NobleProg Lyon, 10 Place Charles Béraudier, Lyon, france, 69000
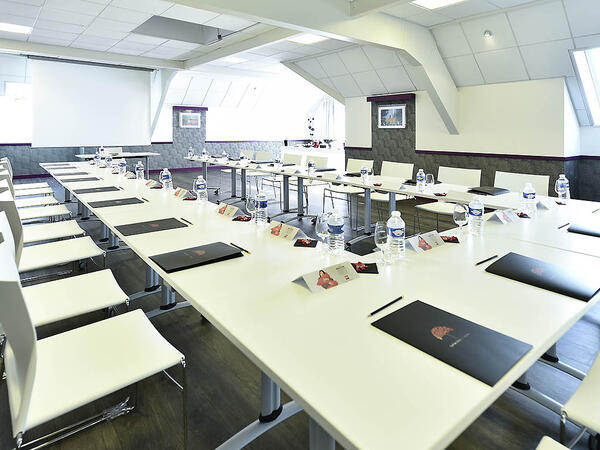
Located 200 meters far from the train station TGV, Swisslife Tower is today the most representative building of this quarter of Lyon. The Business Center offers you a perfect location for your training.
Gares TGV
100meters from Gare TGV Part-Dieu , porte du Rhône Exit
Aéroport
30 minutes from Lyon Saint Exupéry (Satolas)
Rhône Express from Saint Exupéry airport (Terminus Gare part-Dieu)
This instructor-led live training in Lyon (online or onsite) targets intermediate engineers and designers who want to use DFSS to ensure quality is integrated into the product or process from the outset of the design phase.
Upon completion of this training, participants will be capable of:
Grasping the core principles and concepts of Design for Six Sigma (DFSS).
Mastering the DMAIC (Define, Measure, Analyze, Improve, Control) and DMADV (Define, Measure, Analyze, Design, Verify) methodologies.
Applying DFSS tools and techniques to design and optimize processes.
Cultivating the skills necessary to effectively manage and lead DFSS projects.
This instructor-led live training in Lyon (online or onsite) is aimed at advanced-level professionals who wish to gain an in-depth understanding of the Six Sigma DMAIC methodology at a Black Belt level.
By the end of this training, participants will be able to:
Develop a comprehensive understanding of the Define, Measure, Analyze, Improve, and Control phases with a focus on complex projects.
Gain expertise in advanced statistical analysis techniques for data-driven decision-making.
Lead large-scale Six Sigma projects and manage project teams effectively.
Implement significant process improvements that align with organizational goals and strategies.
This instructor-led training in Lyon explores the fundamentals of R Markdown for creating dynamic, reproducible reports. It empowers R users to build code-chunk-based documents, render outputs to HTML, PDF, and Word, and utilize parameterized reports, themes, and LaTeX styling to achieve professional, automated documentation.
This instructor-led, live training in Lyon (online or onsite) targets intermediate-level professionals aiming to develop a comprehensive understanding of the DMAIC methodology and prepare for the role of an effective Six Sigma Green Belt.
By the end of this training, participants will be able to:
Gain thorough knowledge of the Define, Measure, Analyze, Improve, and Control phases of Six Sigma.
Effectively apply a wide range of Six Sigma tools and techniques within each phase of DMAIC.
Perform and interpret statistical analyses for process improvement.
This instructor-led, live training in Lyon (online or onsite) is designed for beginner-level professionals who wish to gain a fundamental understanding of Six Sigma and Lean principles to integrate them and improve business processes.
By the end of this training, participants will be able to:
Obtain a solid understanding of Lean Six Sigma principles.
Use Six Sigma methodologies to improve process quality by removing the causes of defects and minimizing variability.
Integrate Lean and Six Sigma methodologies to achieve more efficient and effective process improvements.
Teach basic Lean Six Sigma tools and techniques that Yellow Belts can apply in process improvement projects, such as 5S, Kaizen, and process mapping.
This instructor-led, live training in Lyon (online or onsite) targets intermediate-level professionals who wish to understand both Six Sigma and Lean principles to lead significant process improvement projects in their organizations.
By the end of this training, participants will be able to:
Develop a comprehensive understanding of how Lean and Six Sigma methodologies can be integrated for process improvement.
Gain in-depth knowledge and application skills in the Define, Measure, Analyze, Improve, and Control phases.
Apply advanced statistical tools for data-driven decision-making and process analysis.
Lead and manage Lean Six Sigma projects effectively.
This instructor-led, live training in Lyon (online or onsite) is designed for data analysts and anyone keen to learn how to use and integrate Tableau, Python, R, and SQL for data visualization and analysis.
By the end of this training, participants will be able to:
Conduct data analysis using Python, R, and SQL.
Derive insights through data visualization with Tableau.
Make data-driven decisions for business operations.
This instructor-led, live training in Lyon (online or onsite) is aimed at beginner-level professionals who wish to clean and analyze data, make statistical projections, and create insightful visualizations using these tools.
By the end of this training, participants will be able to:
Understand the basics of Python, R, Power Query, and Power BI for data analysis.
Clean and organize datasets using Python and Power Query.
Perform statistical analysis and projections with R.
Create professional dashboards and reports with Power BI.
Integrate and analyze data from multiple sources effectively.
This instructor-led, live training in Lyon (online or onsite) targets advanced professionals seeking to acquire the skills necessary to manage complex Six Sigma projects and assume leadership roles in Six Sigma and Lean initiatives.
Upon completing this training, participants will be capable of:
Gaining a thorough understanding of advanced Six Sigma and Lean methodologies and tools.
Leading complex process improvement projects that align with organizational strategies.
Conducting complex statistical analyses to support data-driven decision-making.
Effectively driving change initiatives and fostering a culture of continuous improvement.
This instructor-led, live training in Lyon (online or onsite) is designed for beginner-level professionals who wish to gain a deeper understanding of the Six Sigma methodology, its principles, and mastery of the DMAIC process.
By the end of this training, participants will be able to:
Gain knowledge beyond the basic principles covered in the White Belt course.
Master the DMAIC process and learn advanced Six Sigma tools.
Learn how to effectively contribute to a Six Sigma project team and collaborate with Green and Black Belts.
Apply Six Sigma methodologies to real-world business processes for improvement.
This instructor-led Shiny training in Lyon enables intermediate R users to build interactive web apps without relying on JavaScript. Master the design of reactive UIs, integration of data visualizations, and application deployment. Acquire hands-on skills to efficiently create dynamic dashboards and reports.
This instructor-led, live training in Lyon (offered online or onsite) is designed for beginner-level professionals who wish to gain a basic understanding of the Six Sigma methodology and its principles.
By the end of this training, participants will be able to:
Understand the basics of Six Sigma and learn the DMAIC process.
Understand the specific roles and responsibilities of a White Belt in the context of a Six Sigma project.
Learn how to apply Six Sigma principles to identify improvement opportunities and support Six Sigma projects within an organization.
This instructor-led, live training in Lyon (online or onsite) is designed for scientists who want to learn and apply Design of Experiments (DoE) to understand the cause-and-effect relationships among multiple factors.
By the end of this training, participants will be able to:
Understand the advantages of designed experiments compared to other approaches.
Understand the cause-and-effect relationships and interactions between factors.
Learn the best practices and guidelines for conducting successful experimentation.
This instructor-led live training in Lyon (online or onsite) is designed for individuals seeking to learn and master the fundamentals of econometric analysis and modeling.
Upon completing this training, participants will be able to:
This instructor-led, live training in Lyon (online or onsite) is designed for intermediate to advanced computer science professionals who wish to leverage Stata for statistical analysis and integrate it with R.
Upon completion of this training, participants will be able to:
Utilize Stata effectively for data analysis and statistical modeling.
Compare the functionalities of Stata with those of SPSS and R.
Integrate Stata with R to facilitate seamless statistical computing.
Develop and automate workflows using both Stata and R.
This practical course in Lyon focuses on R fundamentals, data preparation, and visualization utilizing packages such as ggplot2. Over the course of three days, learners delve into statistical modeling, regression analysis, and machine learning methods—including clustering and classification—using authentic real-world data.
This hands-on course in Lyon establishes core data analytics competencies through the use of Excel, VBA, and R. Learners will acquire skills in data manipulation, visualization, and machine learning, enabling them to forecast trends, refine processes, and drive evidence-based business strategies.
Acquire advanced Excel skills for financial analysis, such as INDEX-MATCH, PivotTables, VBA, and Solver, at Lyon. Gain proficiency in Goal Seek, database queries, and external data integration to optimize workflows and convert raw data into strategic insights and predictions.
This instructor-led, live training in Lyon (online or onsite) is aimed at intermediate-level advanced R users who wish to use R to build faster workflows, improve code quality, and handle more complex analysis tasks.
By the end of this training, participants will be able to: create reusable functions, improve data workflows, debug and optimize code, and produce reproducible reports.
Delve into the essentials of leveraging R for Big Data, a language widely adopted in finance. This course in Lyon addresses environment configuration, utilizes MPI for parallel computing, and explores distributed matrices. You will learn to manage massive datasets, execute distributed regression analyses, and implement Monte Carlo methods with enhanced efficiency.
This instructor-led, live training in Lyon (online or onsite) is designed for beginner-level data analysts who wish to use R programming to manipulate data, perform basic data analysis, and create compelling visualizations for insights.
By the end of this training, participants will be able to:
Develop statistical confidence using Minitab in Lyon by exploring core techniques like descriptive statistics, regression methods, and control charts. This course helps you deploy hypothesis testing, ANOVA, and experimental design to find actionable signals in complex datasets.
This instructor-led live training in Lyon (online or onsite) is aimed at process department personnel and operations team members who wish to master practical process improvement techniques using Six Sigma principles and BPMN 2.0 modeling.
Statistics Level 1 equips data professionals with foundational statistical techniques. This training in Lyon addresses data visualization, normal distributions, and critical metrics like mean and variance, fostering a solid quantitative base for practical analytics applications.
This instructor-led, live training in (online or onsite) is aimed at data analysts who wish to use Stata and R to analyze big data for statistical analysis.
By the end of this training, participants will be able to:
Create statistic models for predicting key interest variables and events.
Generate descriptive visualizations, summary tables, frequencies, and more.
Manage and structure large databases to preapare for data analysis.
This instructor-led, live training in Lyon (online or onsite) is designed for advanced-level data professionals who wish to use Tableau to build complex visualizations, optimize dashboards, and perform advanced data analysis.
By the end of this training, participants will be able to install and configure Tableau for advanced use, create advanced calculations, design interactive dashboards, and optimize performance.
This course in Lyon empowers R users to develop web applications using Shiny, eliminating the need for extensive knowledge of HTML or CSS. It explores core principles, UI customization, advanced reactive mechanisms, and data sharing, offering practical insights for crafting dynamic and interactive data solutions.
This instructor-led live training in Lyon (online or onsite) is designed for intermediate-level data analysts and business professionals who wish to perform time series forecasting and automate data analysis workflows using R.
Upon completion of this training, participants will be able to:
Grasp the fundamentals of forecasting techniques within R.
Apply ARIMA models and exponential smoothing methods for time series analysis.
Utilize the 'forecast' package to develop accurate forecasting models.
Automate forecasting workflows for both business and research purposes.
Read more...
Last Updated:
Testimonials (11)
trainer knowledge
SUNEEL jee - House of Spices India
Course - Six Sigma LEAN Yellow Belt
The great atmosphere
Keivan Diakite - Sigedis
Course - Tableau Advanced
Machine Translated
a multitude of points
Joanna - Instytut Ekonomiki Rolnictwa i Gospodarki Zywnosciowej-PIB
Course - Statistical Analysis with Stata and R
knowledge of the trainer, tailor based, all topics covered
eleni - EUAA
Course - Forecasting with R
The variation with exercise and showing.
Ida Sjoberg - Swedish National Debt Office
Course - Econometrics: Eviews and Risk Simulator
The focus more on practical concepts, doing different exercises in statistics software.
Florin - Zentiva SA
Course - Statistics Level 1
The real life applications using Statcan and CER as examples.
Matthew - Natural Resources Canada
Course - Data Analytics With R
Trainer was good. Had a good rapport with him. Was able to ask him anything and was knowledgeable.
Pranay - Lotterywest
Course - Building Web Applications in R with Shiny
Very practical
Deenan - Vodacom
Course - Data and Analytics - from the ground up
I learned new things so that is a good point
Daria - LKQ Polska Sp. z o. o.
Course - Analysing Financial Data in Excel
I liked the excercises and how great it was to follow
Online Statistics training in Lyon, Statistics training courses in Lyon, Weekend Statistics courses in Lyon, Evening Statistics training in Lyon, Statistics instructor-led in Lyon, Weekend Statistics training in Lyon, Online Statistics training in Lyon, Statistics on-site in Lyon, Statistics instructor in Lyon, Evening Statistics courses in Lyon, Statistics boot camp in Lyon, Statistics instructor-led in Lyon, Statistics one on one training in Lyon, Statistics trainer in Lyon, Statistics classes in Lyon, Statistics coaching in Lyon, Statistics private courses in Lyon