Online or onsite, instructor-led live Data Visualization training courses demonstrate through discussion and hands-on practice the skills, strategies, tools and approaches for visualizing and reporting data for different audiences. Case studies are also analyzed and discussed to exemplify how data visualization solutions are being applied in the real world to derive meaning out of data and answer crucial questions..
Data Visualization training is available as "online live training" or "onsite live training". Online live training (aka "remote live training") is carried out by way of an interactive, remote desktop. Onsite live Data Visualization training can be carried out locally on customer premises in Nantes or in NobleProg corporate training centers in Nantes.
NobleProg -- Your Local Training Provider
Nantes, Zenith
NobleProg Nantes, 4 rue Edith Piaf, Saint-Herblain, france, 44821
In the Parc d'Ar Mor zone, near the Zénith.
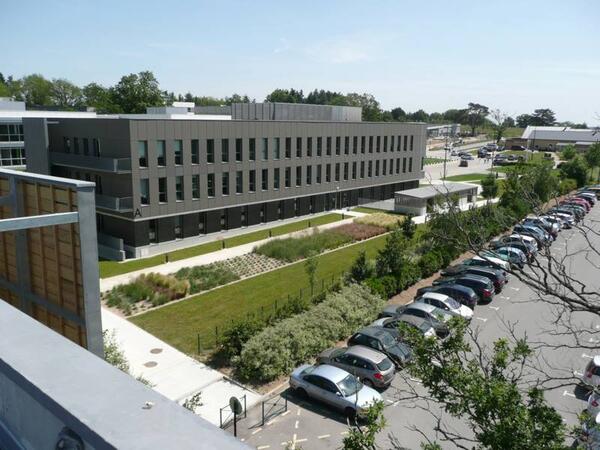
Car : from the ring road, Porte de Chézine Exit> Boulevard du Zenith > Esplanade Georges Brassens (restaurants) > Rue Edith Piaf on the right. From the N444 road (Nantes > Lorient), Exit #1 > boulevard Marcel Paul > Rue Edith Piaf at the right.
Parking Zénith P1 (free). Once parked, you can recognize the building: it's one of the tree bulding with zinc frontage.
Bicycle: free indoor parking
Public transport :
Tramway R1, Schoelcher station + 10 mn by foot through commercial center Atlantis
Tramway R1, François Mitterrand stop + bus 50, stop at Saulzaie station or bus 71, stop at the Zénith station
Tramway R3, Marcel Paul station + bus 50, Saulzaie station
Chronobus C6, Hermeland station+ bus 71, Zénith station
Bus : lignes 50 (Saulzaie station) or 71 (Zénith station)
Grafana and Prometheus are industry-standard tools used to monitor, visualize, and alert on IT infrastructure and application metrics through real-time dashboards and integrations.
This instructor-led, live training (online or onsite) is aimed at intermediate-level to advanced-level IT professionals who wish to integrate Grafana with Prometheus and multiple data sources, and build actionable visualizations and alerts across distributed systems.
By the end of this training, participants will be able to:
Install and configure Grafana and Prometheus in production-ready setups.
Integrate multiple data sources including SQL, Elasticsearch, InfluxDB, and cloud APIs.
Create advanced dashboards with variables, templating, transformations, and alerts.
Apply best practices in data modeling, performance tuning, and user access control.
Format of the Course also allows for the evaluation of participants.
Interactive lecture and discussion.
Lots of exercises and practice.
Hands-on implementation in a live-lab environment.
Course Customization Options
To request a customized training for this course, please contact us to arrange.
This instructor-led, live training in Nantes (online or onsite) is aimed at intermediate-level Grafana users who wish to build interactive, drill-down dashboards with dynamic thresholds and contextual updates.
By the end of this training, participants will be able to:
Create dashboards that respond to user interactions, such as clicking a graph bar
Implement visual drill-downs that update in-place (without new tabs)
Configure pie charts and detailed panels based on selection filters
Use dynamic thresholds that react to user input and real-time data
This instructor-led live training in Nantes (online or onsite) targets intermediate-level system administrators and monitoring professionals aiming to effectively utilize Grafana for establishing monitoring solutions, managing dashboards, and generating alerts.
Upon completion of this training, participants will be capable of:
Distinguishing between observability and monitoring.
Installing and configuring the Grafana server.
Configuring and connecting diverse data sources including Prometheus, InfluxDB, and ElasticSearch.
Creating, managing, and customizing dashboards and charts.
Utilizing variables and queries to build dynamic dashboards.
Setting up notifications and alerts via Grafana.
Installing and managing plugins to enhance Grafana’s capabilities.
This instructor-led, live training in Nantes (online or onsite) is aimed at advanced-level DevOps engineers and SREs who wish to manage and scale Prometheus and Grafana for large environments effectively.
By the end of this training, participants will be able to:
Architect Prometheus and Grafana for large-scale and distributed environments.
Optimize Prometheus performance for high-traffic systems.
Configure Grafana for large datasets and complex visualizations.
Implement advanced troubleshooting and scalability strategies.
This instructor-led, live training in Nantes (online or onsite) is aimed at intermediate-level developers and DevOps engineers who wish to instrument their applications to export and monitor custom metrics effectively using Prometheus and Grafana.
By the end of this training, participants will be able to:
Understand the importance of custom metrics for application monitoring.
Instrument applications to export custom metrics for Prometheus.
Create and configure dashboards in Grafana to visualize custom metrics.
Apply best practices for integrating monitoring into the development lifecycle.
This instructor-led, live training in Nantes (online or onsite) is aimed at advanced-level Kubernetes administrators and DevOps engineers who wish to enhance their monitoring skills for Kubernetes clusters using Prometheus and Grafana.
By the end of this training, participants will be able to:
Set up Prometheus and Grafana for Kubernetes monitoring.
Monitor key metrics for pods, nodes, and services.
Create dynamic dashboards to visualize cluster health and performance.
Implement alerting strategies for proactive issue resolution.
Apply best practices for scaling monitoring solutions in Kubernetes environments.
This instructor-led, live training in Nantes (online or onsite) is aimed at advanced-level DevOps and SRE professionals who wish to enhance their alerting and automation skills with Grafana and Prometheus.
By the end of this training, participants will be able to:
Create and manage advanced alerting rules in Prometheus.
Integrate Prometheus Alertmanager with external tools using webhooks.
Automate responses to alerts for faster issue resolution.
Use Grafana to visualize and manage alerts effectively.
This instructor-led, live training in Nantes (online or onsite) is designed for intermediate-level cloud and DevOps engineers aiming to enhance cloud observability using Grafana and Prometheus.
Upon completion of this training, participants will be able to:
Understand the benefits of integrating Grafana and Prometheus with cloud platforms.
Set up Prometheus for monitoring cloud-based resources.
Configure Grafana for visualizing cloud service metrics.
Leverage cloud-native tools and integrations for monitoring scalability.
This instructor-led live training in Nantes (online or on-site) is designed for intermediate-level DevOps and SRE professionals looking to create impactful dashboards and optimize their monitoring practices using Grafana and Prometheus.
By the end of this training, participants will be able to:
Understand best practices for designing effective dashboards.
Create and configure advanced Grafana dashboard elements.
Leverage Grafana templating for dynamic and reusable dashboards.
Implement alerting mechanisms to enhance operational awareness.
This instructor-led, live training in Nantes (online or onsite) is tailored for beginner-level system administrators and DevOps engineers who wish to develop core monitoring skills using Grafana and Prometheus.
By the end of this training, participants will be able to:
Understand the purpose and importance of monitoring in IT environments.
Install and configure Grafana and Prometheus for basic monitoring tasks.
Create simple dashboards and alerts to visualize system performance.
Apply best practices for monitoring system availability and performance.
This instructor-led, live training in Nantes (online or onsite) is aimed at beginner-level data scientists who wish to learn how to create meaningful and visually appealing data visualizations.
By the end of this training, participants will be able to:
Set up and navigate Google Colab for data visualization.
Create various types of plots using Matplotlib.
Utilize Seaborn for advanced visualization techniques.
Customize plots for better presentation and clarity.
Interpret and present data effectively using visual tools.
This instructor-led, live training in Nantes (online or onsite) is aimed at beginner-level IT professionals and DevOps practitioners who wish to learn the basics of Grafana and Prometheus.
By the end of this training, participants will be able to:
Understand the purpose and key features of Grafana and Prometheus.
Install and configure Grafana and Prometheus on a Linux environment.
Set up basic data sources and dashboards in Grafana.
Monitor system metrics and visualize data using Prometheus.
The Elastic Stack (ELK) is a robust platform designed for the real-time search, analysis, and visualization of log data collected from various sources.
This instructor-led live training, available online or on-site, is designed for intermediate IT professionals aiming to deepen their expertise in the ELK Stack. The course focuses on managing distributed log data, automating alert systems, and developing sophisticated visualizations and dashboards.
Upon completion of this training, participants will be equipped to:
Set up advanced ingestion and parsing workflows for multiple sources, including databases.
Design tailored Kibana dashboards to suit specific teams or use cases.
Deploy email notifications and condition-driven alerts.
Apply regular expressions to enhance the precision of log searches.
Administer user roles and access permissions to ensure secure log environments.
Utilize the Elasticsearch REST API for automation and system integration.
Course Format
Interactive lectures and discussions.
Extensive exercises and practical practice.
Hands-on implementation within a live laboratory environment.
Customization Options
To arrange customized training for this course, please contact us directly.
This instructor-led, live training in Nantes (online or onsite) is aimed at beginner to intermediate-level IT professionals who wish to gain the knowledge and practical skills necessary to excel in the administration of Grafana and GLPI.
By the end of this training, participants will be able to:
Create and customize Grafana dashboards with different visualizations.
Implement alerting and notifications for monitoring.
Administer user accounts, teams, and permissions.
Manage IT assets effectively, including hardware and software inventory.
Implement a helpdesk system for user support and ticket management.
This instructor-led, live training in Nantes (online or onsite) is aimed at intermediate-level administrators and developers who wish to deepen their understanding of Elasticsearch administration, including advanced techniques for dashboard development in Kibana, as well as maintenance of the system.
By the end of this training, participants will be able to:
Set up and configure Elasticsearch and Kibana environments for advanced administration and dashboard development.
Create and manage Elasticsearch indices, mappings, and data models.
Develop advanced queries and filters to extract valuable insights from Elasticsearch data.
Design and build interactive dashboards in Kibana using various visualization types and techniques.
Implement best practices for Elasticsearch and Kibana administration, optimization, and troubleshooting.
Data analysis involves examining, cleaning, transforming, and modeling data to uncover actionable insights, draw conclusions, and support strategic decision-making.
This instructor-led live training (available online or onsite) is designed for intermediate-level professionals who want to effectively manage, analyze, and visualize data to enhance performance and decision support.
Upon completion of this training, participants will be able to:
Create and manage databases.
Apply regression, classification, and fundamental machine learning models.
Develop dynamic reports and dashboards using Excel and Power BI.
Utilize statistical methods to inform decisions and analyze trends.
Course Format
Interactive lectures and discussions.
Extensive exercises and practical practice.
Hands-on implementation in a live laboratory environment.
Customization Options
To request a customized version of this course, please contact us to arrange details.
This instructor-led live training in Nantes (online or onsite) is designed for intermediate-level data analysts who wish to learn and utilize the advanced features and components of Grafana for data visualization and analysis.
By the end of this training, participants will be able to:
Gain an in-depth understanding of advanced Grafana concepts and components.
Leverage template variables and dynamic dashboards for enhanced data visualization.
Use Grafana Query Language for complex queries.
Learn best practices for scaling Grafana, optimizing performance, and ensuring high availability.
This instructor-led, live training in Nantes (online or onsite) is targeted at data analysts who want to build analytical applications using Python, Plotly, and Dash.
Upon completion of this training, participants will be able to:
Configure a real-time interactive dashboard for streaming live-updating data.
Create interactive dashboards using Python for data science solutions.
Enhance the security of interactive dashboards by implementing advanced authentication methods.
This course explores human perception and demonstrates how to harness it to deliver maximum insight. Participants will become acquainted with design theory, covering Gestalt Laws, pre-attentive attributes, and inclusive design practices. The curriculum also clarifies the distinctions and overlaps between exploratory and explanatory analysis. Learners will gain expertise in selecting the most appropriate chart types for specific data needs. By the end of the training, you will understand how to effectively apply design principles to visualizations built with Tableau software.
This instructor-led, live training in Nantes is designed for system administrators who want to set up an ELK stack (Elasticsearch, Logstash, Kibana). Note that a minimum of 3 delegates is needed for this course to run.
The course begins with a discussion of ELK architecture and functionality, then moves on to live lab implementation and practice. Hands-on exercises make up an important part of the training and give participants a chance to put into practice their knowledge while receiving feedback on their progress.
This instructor-led live training in Nantes (online or onsite) targets web developers and DevOps engineers who wish to visualize and monitor data using Grafana and Graphite.
By the end of this training, participants will be able to:
Aggregate and visualize metrics about systems and applications.
Create a StatsD client for gathering application metrics.
Build informative and dynamic dashboards with Grafana.
Discover how to retrieve and transform data to build interactive dashboards.
Power BI stands as one of the most widely used data visualization and business intelligence tools. It comprises a suite of data connectors, applications, and software services designed to extract data from various sources, transform it, and generate visually appealing reports.
Additionally, Power BI enables you to publish reports within your organization, making them accessible across mobile devices, tablets, and other platforms. In this Power BI tutorial, we guide you through a step-by-step process for connecting to multiple data sources, performing data transformations, and creating visual elements such as charts, tables, matrices, and maps.
In this instructor-led, live training at Nantes (onsite or remote), participants will learn how to use Microsoft Power BI to analyze and visualize data using a series of sample data sets.
By the end of this training, participants will be able to:
Create visually compelling dashboards that provide valuable insights into data.
Obtain and integrate data from multiple data sources.
This instructor-led, live training in Nantes (online or onsite) is targeted at data analysts and data scientists who wish to use Python to construct interactive data visualizations directly from code.
By the end of this training, participants will be able to:
Configure the necessary development environment to start creating data visualizations with Python.
Understand the fundamental concepts, use cases, and tools of data visualization.
Explore the various Python libraries available (Matplotlib, Seaborn, Bokeh, and Folium).
Learn how to create line plots, statistical graphs, geo-spatial visualizations, and other complex data representations with Python.
Understand the best practices and techniques for presenting and interpreting data.
Tableau is a business intelligence and data visualization tool. Python is a widely used programming language which provides support for a wide variety of statistical and machine learning techniques. Tableau's data visualization power and Python's machine learning capabilities, when combined, help developers rapidly build advanced data analytics applications for various business use cases.
In this instructor-led, live training, participants will learn how to combine Tableau and Python to carry out advanced analytics. Integration of Tableau and Python will be done via the TabPy API.
By the end of this training, participants will be able to:
Integrate Tableau and Python using TabPy API
Use the integration of Tableau and Python to analyze complex business scenarios with few lines of Python code
Audience
Developers
Data scientists
Format of the course
Part lecture, part discussion, exercises and heavy hands-on practice
Designed for learners new to Tableau or those needing a refresher, this course walks you through the essential steps to build your first visualization from scratch. You will learn how to apply key design principles to your Tableau visualizations. By the end of the course, you will be able to create and share your insights with a broader audience.
This instructor-led live training Nantes (online or onsite) targets developers interested in utilizing BusinessEvents and ActiveMatrix Service Bus to develop, deploy, and manage event-driven applications.
Upon completion of this training, participants will gain the ability to:
Configure the requisite development environment to commence application development.
Construct distributed, stateful, and rule-based event processing systems.
Oversee business event data and enforce appropriate business rules.
Decrease event response times within large-scale, data-centric applications.
Develop applications for scenarios such as fraud detection, track-and-trace capabilities, and real-time customer offer generation.
This instructor-led live training in Nantes (online or onsite) is aimed at engineers, researchers, and data analysts who wish to use TIBCO Statistica features to create analytic workflows and models.
By the end of this training, participants will be able to:
Install and navigate the TIBCO Statistica program to build and manage data analysis projects.
Understand statistics basics to analyze data and generate useful insights for the business.
Explore advanced topics to work with big data and machine learning using TIBCO Statistica.
This engaging four-day course is designed for Tableau beginners. Participants will become familiar with all Tableau features and learn how to create and share data visualizations with others. The course will guide you through every step, including connecting to data, creating calculations, choosing a chart, building the dashboard, and publishing your work.
The course is divided into lectures dedicated to each topic, followed by practical exercises. The course will end with a 30-minute test and a 60-minute project assignment.
Course milestones:
Get familiar with Tableau interface.
Connect to and work with your data.
Use the Tableau features.
Build an insightful visualization.
Share your work with a broader audience.
Format of the Course also allows for the evaluation of participants.:
Interactive lecture and discussion.
Lots of exercises and practice.
Hands-on implementation in a live-lab environment.
Knowledge test and hands-on project at the end of the course
Read more...
Last Updated:
Testimonials (7)
Smart work reporting criteria
Siyabonga Kubeka - NTCSA
Course - Power BI for Business Analysts
workshops, practical examples
Martin Stuparek - Orange Slovensko, a.s.
Course - Monitoring with Grafana
The content is very helpful, and the trainer makes it more easier to understand
Ibrahim Al mayahi - Vastech SA
Course - Advanced Elasticsearch and Kibana Administration
the relevance of the trainer and the exchange
Benjamin - Worldline
Course - Advanced Grafana
Machine Translated
The training was well adapted to my needs, with an exercise on the second day involving the creation of a dashboard for which I was able to propose and send the data and layout myself.
Agathe - Audap
Course - Python with Plotly and Dash
Machine Translated
- Building dashboards
- Learning the counts and SUMs and SWITCH
-
Thereso - South African National AIDS Council Trust
Course - Power BI Dashboards
The joyful atmosphere, the openness of the knowledgeable trainer who offered us a lot of tips and tricks.
Online Data Visualization training in Nantes, Data Visualization training courses in Nantes, Weekend Data Visualization courses in Nantes, Evening Data Visualization training in Nantes, Data Visualization instructor-led in Nantes, Data Visualization trainer in Nantes, Data Visualization classes in Nantes, Online Data Visualization training in Nantes, Data Visualization private courses in Nantes, Data Visualization boot camp in Nantes, Weekend Data Visualization training in Nantes, Data Visualization instructor-led in Nantes, Data Visualization instructor in Nantes, Evening Data Visualization courses in Nantes, Data Visualization on-site in Nantes, Data Visualization coaching in Nantes, Data Visualization one on one training in Nantes