Whether delivered online or onsite, our instructor-led live Data Analysis (also known as Data Analytics) courses guide participants through the programming languages and methodologies used to perform Data Analysis, combining in-depth discussion with hands-on practice.
These Data Analysis courses are offered as either "online live training" or "onsite live training". Online live training (also referred to as "remote live training") is conducted via an interactive remote desktop. Onsite live training can be hosted locally at customer premises in Nantes or at NobleProg corporate training centers in Nantes.
NobleProg -- Your Local Training Provider
Nantes, Zenith
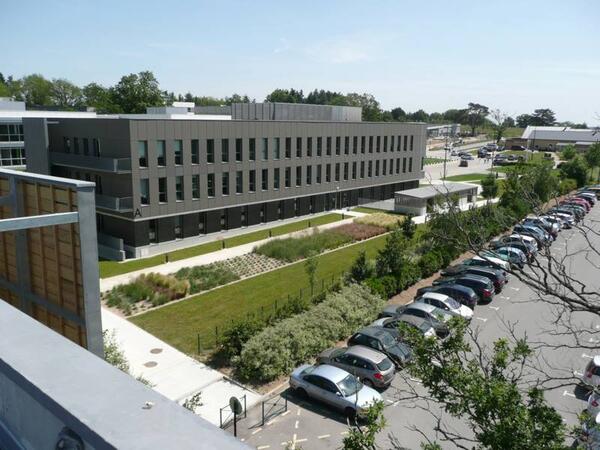
NobleProg Nantes, 4 rue Edith Piaf, Saint-Herblain, france, 44821
In the Parc d'Ar Mor zone, near the Zénith.
Car : from the ring road, Porte de Chézine Exit> Boulevard du Zenith > Esplanade Georges Brassens (restaurants) > Rue Edith Piaf on the right. From the N444 road (Nantes > Lorient), Exit #1 > boulevard Marcel Paul > Rue Edith Piaf at the right.
Parking Zénith P1 (free). Once parked, you can recognize the building: it's one of the tree bulding with zinc frontage.
Bicycle: free indoor parking
Public transport :
Tramway R1, Schoelcher station + 10 mn by foot through commercial center Atlantis
Tramway R1, François Mitterrand stop + bus 50, stop at Saulzaie station or bus 71, stop at the Zénith station
Tramway R3, Marcel Paul station + bus 50, Saulzaie station
Chronobus C6, Hermeland station+ bus 71, Zénith station
Bus : lignes 50 (Saulzaie station) or 71 (Zénith station)
This instructor-led, live training in Nantes (online or onsite) is aimed at intermediate-level Grafana users who wish to build interactive, drill-down dashboards with dynamic thresholds and contextual updates.
By the end of this training, participants will be able to:
Create dashboards that respond to user interactions, such as clicking a graph bar
Implement visual drill-downs that update in-place (without new tabs)
Configure pie charts and detailed panels based on selection filters
Use dynamic thresholds that react to user input and real-time data
This instructor-led, live training in Nantes (online or onsite) is aimed at intermediate-level data scientists and engineers who wish to use Google Colab and Apache Spark for big data processing and analytics.
By the end of this training, participants will be able to:
Set up a big data environment using Google Colab and Spark.
Process and analyze large datasets efficiently with Apache Spark.
Visualize big data in a collaborative environment.
This instructor-led live training in Nantes (online or onsite) targets intermediate-level system administrators and monitoring professionals aiming to effectively utilize Grafana for establishing monitoring solutions, managing dashboards, and generating alerts.
Upon completion of this training, participants will be capable of:
Distinguishing between observability and monitoring.
Installing and configuring the Grafana server.
Configuring and connecting diverse data sources including Prometheus, InfluxDB, and ElasticSearch.
Creating, managing, and customizing dashboards and charts.
Utilizing variables and queries to build dynamic dashboards.
Setting up notifications and alerts via Grafana.
Installing and managing plugins to enhance Grafana’s capabilities.
This live, instructor-led training in Nantes dives deep into the Stratio platform, specifically highlighting the Rocket and Intelligence modules in conjunction with PySpark. Participants will gain mastery over data ingestion, transformation, and advanced analytics, acquiring hands-on expertise in loops, UDFs, and enterprise-grade data workflows.
This instructor-led program in Nantes empowers public sector professionals to integrate data into their strategic decisions. Participants will learn to verify data reliability, pose critical questions, and accurately interpret dashboards. You will also gain the skills to apply evidence to defend decisions and articulate findings clearly to stakeholders.
This instructor-led, live training in Nantes (online or onsite) is aimed at intermediate-level data professionals who wish to apply time series forecasting techniques to real-world data using Google Colab.
By the end of this training, participants will be able to:
Understand the fundamentals of time series analysis.
Use Google Colab to work with time series data.
Apply ARIMA models to forecast data trends.
Utilize Facebook’s Prophet library for flexible forecasting.
Visualize time series data and forecasting results.
This instructor-led, live training in Nantes (online or onsite) is aimed at intermediate-level developers and DevOps engineers who wish to instrument their applications to export and monitor custom metrics effectively using Prometheus and Grafana.
By the end of this training, participants will be able to:
Understand the importance of custom metrics for application monitoring.
Instrument applications to export custom metrics for Prometheus.
Create and configure dashboards in Grafana to visualize custom metrics.
Apply best practices for integrating monitoring into the development lifecycle.
This live, instructor-led training in Nantes assists public sector professionals in strengthening their digital intelligence capabilities. It covers data literacy, visualization tools, and practical governance use cases to facilitate improved decision-making and service delivery.
This live training in Nantes empowers public sector professionals to turn complex data into clear, compelling visual narratives. Participants will gain expertise in chart selection, narrative structure, and visual clarity best practices, ideal for elevating the impact of data presentations.
This instructor-led, live training in Nantes (online or onsite) is aimed at advanced-level DevOps and SRE professionals who wish to enhance their alerting and automation skills with Grafana and Prometheus.
By the end of this training, participants will be able to:
Create and manage advanced alerting rules in Prometheus.
Integrate Prometheus Alertmanager with external tools using webhooks.
Automate responses to alerts for faster issue resolution.
Use Grafana to visualize and manage alerts effectively.
By completing this instructor-led, live training in Nantes, participants will acquire a practical, real-world understanding of Big Data, along with its associated technologies, methodologies, and tools.
Participants will have the chance to apply this knowledge through hands-on exercises. Group interaction and instructor feedback are key components of the class.
The course begins with an introduction to the fundamental concepts of Big Data, then moves on to the programming languages and methodologies used for Data Analysis. Finally, we discuss the tools and infrastructure that facilitate Big Data storage, Distributed Processing, and Scalability.
This instructor-led program in Nantes empowers intermediate GIS professionals with expert-level ArcGIS Pro Plus competencies. Learners will acquire mastery in 3D modeling, advanced spatial analysis, and Python-driven automation to construct resilient geospatial workflows suitable for enterprise settings.
This instructor-led, live training in Nantes (online or onsite) is aimed at beginner-level data engineers, analysts, and scientists who wish to understand how to use dbt Cloud to manage their data warehousing and transformation projects in the cloud.
By the end of this training, participants will be able to:
Create and manage projects on dbt Cloud.
Use the dbt Cloud interface to schedule and run data transformations.
This instructor-led, live training in Nantes (online or onsite) is designed for intermediate-level cloud and DevOps engineers aiming to enhance cloud observability using Grafana and Prometheus.
Upon completion of this training, participants will be able to:
Understand the benefits of integrating Grafana and Prometheus with cloud platforms.
Set up Prometheus for monitoring cloud-based resources.
Configure Grafana for visualizing cloud service metrics.
Leverage cloud-native tools and integrations for monitoring scalability.
This instructor-led live training in Nantes (online or on-site) is designed for beginner to advanced GIS professionals and analysts who wish to learn how to effectively use ArcGIS for data visualization, spatial analysis, and geospatial project management.
By the end of this training, participants will be able to:
Navigate and utilize ArcGIS tools for geospatial data management.
Create and customize maps with layers and attributes.
Perform advanced spatial analysis and geoprocessing tasks.
This instructor-led live training in Nantes (online or on-site) is designed for intermediate-level DevOps and SRE professionals looking to create impactful dashboards and optimize their monitoring practices using Grafana and Prometheus.
By the end of this training, participants will be able to:
Understand best practices for designing effective dashboards.
Create and configure advanced Grafana dashboard elements.
Leverage Grafana templating for dynamic and reusable dashboards.
Implement alerting mechanisms to enhance operational awareness.
This instructor-led, live training in Nantes (online or onsite) is aimed at advanced-level GIS professionals who wish to use ArcGIS Pro to enhance their spatial analysis capabilities, conduct comprehensive geostatistical analysis, and apply advanced 3D modeling techniques for more effective decision-making and problem-solving in real-world scenarios.
By the end of this training, participants will be able to:
Develop advanced skills in spatial analysis techniques using ArcGIS Pro.
Utilize Python scripting for automation and complex data processing.
Apply spatial modeling for problem-solving in real-world scenarios.
Conduct geostatistical analysis for advanced data interpretation.
Integrate external data sources and leverage 3D spatial data analysis.
This instructor-led, live training in Nantes (online or onsite) is designed for beginner to intermediate data analysts and business professionals who want to perform complex data analysis tasks more intuitively across various industries using Google Gemini AI.
By the end of this training, participants will be able to:
This instructor-led, live training in Nantes (online or onsite) is designed for data analysts and anyone keen to learn how to use and integrate Tableau, Python, R, and SQL for data visualization and analysis.
By the end of this training, participants will be able to:
Conduct data analysis using Python, R, and SQL.
Derive insights through data visualization with Tableau.
Make data-driven decisions for business operations.
This instructor-led live training, offered Nantes (online or onsite), is targeted at beginner-level IT support professionals seeking to deliver reliable support for ArcGIS Enterprise and effectively address system anomalies or failures.
By the end of this training, participants will be able to:
Understand the architecture and core components of ArcGIS Enterprise.
Install, configure, and manage ArcGIS Enterprise.
Develop skills to troubleshoot and resolve common issues.
Gain proficiency in monitoring and maintaining ArcGIS Enterprise environments.
Master techniques for backup, recovery, and performance optimization.
This instructor-led, live training in Nantes (online or onsite) is aimed at beginner-level IT professionals and DevOps practitioners who wish to learn the basics of Grafana and Prometheus.
By the end of this training, participants will be able to:
Understand the purpose and key features of Grafana and Prometheus.
Install and configure Grafana and Prometheus on a Linux environment.
Set up basic data sources and dashboards in Grafana.
Monitor system metrics and visualize data using Prometheus.
This instructor-led, live training in Nantes (online or onsite) is aimed at intermediate-level data engineers who wish to become proficient in utilizing Azure Synapse Analytics for a wide range of data processing, analytics, and visualization.
By the end of this training, participants will be able to:
Understand the core concepts, architecture, and components of Azure Synapse Analytics.
Create, configure, and manage scalable data warehouses using Azure Synapse.
Master the techniques for ingesting, transforming, and loading data (ETL) from various sources into Azure Synapse.
Optimize query performance, secure data, and integrate Azure Synapse with Power BI and other tools to visualize data and share insights.
This instructor-led live training in Nantes (online or onsite) is designed for beginner-level professionals who want to master the foundational concepts and tools of ArcGIS.
By the end of this course, participants will be able to:
Grasp fundamental GIS and spatial data principles.
This instructor-led, live training in Nantes (online or onsite) is aimed at beginner-level earth sciences and engineering professionals who wish to use Python for geospatial analysis in both ArcGIS and QGIS environments.
By the end of this training, participants will be able to:
Learn Python syntax and control structures for executing geospatial tasks efficiently.
Use Pandas, Numpy, and Matplotlib for data analysis and visualization in GIS.
Manipulate and analyze vector data with Geopandas, Arcpy, and PyQGIS libraries.
Automate geospatial processes and workflows using Python scripting in ArcGIS and QGIS.
Develop custom Python-based geoprocessing tools for ArcGIS and QGIS to streamline tasks.
This instructor-led live training in Nantes delves into advanced big data methodologies, distributed computing, and large-scale machine learning. It is designed for expert data professionals who aim to master real-time analytics, deep learning integration, and robust data governance strategies.
This instructor-led, live training in Nantes (online or onsite) is designed for intermediate-level geographers seeking to deepen their expertise in spatial analysis, data management, and GIS applications.
By the end of this training, participants will be able to:
Apply advanced spatial analysis techniques to solve complex geographical problems.
Manage large spatial databases and perform data quality control.
Create dynamic and interactive maps and visualizations for various applications.
Utilize programming and automation to streamline GIS workflows.
This instructor-led live training in Nantes (online or onsite) is designed for intermediate-level data analysts who wish to learn and utilize the advanced features and components of Grafana for data visualization and analysis.
By the end of this training, participants will be able to:
Gain an in-depth understanding of advanced Grafana concepts and components.
Leverage template variables and dynamic dashboards for enhanced data visualization.
Use Grafana Query Language for complex queries.
Learn best practices for scaling Grafana, optimizing performance, and ensuring high availability.
A practical training module in Nantes that enables insurance professionals to leverage AI, data, and InsurTech trends to modernize operations and enhance customer engagement. Through workshops, case studies, and practical exercises, participants will build robust digital strategies for a rapidly evolving industry.
This instructor-led live training in Nantes delves into practical RE concepts, elicitation methods, and documentation strategies. It offers comprehensive exam preparation to help participants master the IREB CPRE syllabus and succeed in the Foundation Level certification.
This practical course in Nantes focuses on R fundamentals, data preparation, and visualization utilizing packages such as ggplot2. Over the course of three days, learners delve into statistical modeling, regression analysis, and machine learning methods—including clustering and classification—using authentic real-world data.
This hands-on course in Nantes establishes core data analytics competencies through the use of Excel, VBA, and R. Learners will acquire skills in data manipulation, visualization, and machine learning, enabling them to forecast trends, refine processes, and drive evidence-based business strategies.
This instructor-led, live training in Nantes (online or onsite) is aimed at intermediate-level Python developers and data analysts who wish to enhance their skills in data analysis and manipulation using Pandas and NumPy.
By the end of this training, participants will be able to:
Set up a development environment that includes Python, Pandas, and NumPy.
Create a data analysis application using Pandas and NumPy.
Perform advanced data wrangling, sorting, and filtering operations.
Conduct aggregate operations and analyze time series data.
Visualize data using Matplotlib and other visualization libraries.
This instructor-led live training in Nantes (online or onsite) is aimed at developers and administrators who wish to use OpenSearch to perform distributed search and data analytics in a unified and secure system.
By the end of this training, participants will be able to:
Set up the necessary development environment to start building search and analytics solutions with OpenSearch and OpenSearch Dashboards.
Understand the three approaches (snapshot, restart, and rolling) in upgrading from Elasticsearch OSS to OpenSearch.
Learn how to index data, create data streams, run queries, and streamline cross-cluster operations in OpenSearch.
Explore and use plugins, APIs, clients, and ingestion tools (Beats, Logstash, Grafana, etc.) to optimize search experience while keeping clusters secure.
Use OpenSearch Dashboards to centralize data management, visualization, logging, monitoring, and maintenance.
This instructor-led, live training in Nantes (online or onsite) is aimed at persons who wish to learn just enough Python to begin crunching numbers from sales data, traffic analytics, customer interactions, etc..
By the end of this training, participants will be able to:
Install and configure the necessary software, libraries and development environment to begin writing Python code for data analysis.
Analyze data from sources such as Excel, CSV, JSON files and databases.
Clean data to improve its usefulness before analyzing it.
Perform simple statistical analysis.
Generate reports that present the desired data in just the right format, from straight numbers to data visualizations.
Gain valuable insight from data, including trends in performance, problematic areas.
This Nantes course offers a deep dive into advanced SQL techniques for analysts, focusing on efficient data selection, filtering, and sorting. Learners will gain proficiency in joins, subqueries, and analytic functions such as RANK and LAG, enabling them to perform complex data analysis natively within Oracle, SQL Server, or MS Access environments.
This training, delivered by an instructor in Montpellier or remotely (online or onsite), is intended for beginners and/or intermediate learners who wish to acquire a solid foundation in Object-Oriented Python, software quality, and best practices.
By the end of the training, participants will be able to:
Write clean, structured Python code
Design object-oriented architecture
Apply SOLID principles and best practices
Implement robust unit tests
Establish a comprehensive software quality process
This instructor-led, live training in Nantes (online or onsite) targets business analysts eager to acquire advanced Spotfire Analyst techniques for data analysis.
By the conclusion of this training, participants will be capable of:
Sharing visualizations with various team members.
Securing software access through defined roles and access controls.
Creating visual elements like map charts.
Integrating statistical computing languages such as R with Spotfire.
This instructor-led, live training in Nantes (online or onsite) is targeted at field ecologists and conservation managers who want to develop spatial data projects using ArcGIS.
By the end of this training, participants will be able to:
Output spatial data as visualizations.
Conduct geostatics on actual data.
Implement spatial data analysis, data processing, and mapping with ArcGIS.
This instructor-led, live training in Nantes (online or on-site) is designed for data scientists, data analysts, and business analysts who wish to clean and process data effectively.
By the end of this training, participants will be able to:
This live, instructor-led training in Nantes, offered online or onsite, targets intermediate-level managers and specialists who aim to grasp the forces driving digital change in financial services and learn how to apply these changes within their own organizations.
Upon completion of this training, participants will be able to:
• Explain the key drivers of digital change in banking and financial services. • Identify value creation opportunities through digital channels, lending, and SME banking. • Understand how Agile and product thinking facilitate transformation. • Draw insights from both successful and unsuccessful transformations.
In the dynamic energy industry, combining electrical transient analysis with accurate geographic data has become a strategic imperative. Relying on disjointed information currently exposes operations to substantial risks. This intensive 14-day course in Melbourne is crafted to connect electrical engineering expertise with geospatial management.
This instructor-led training in Nantes introduces KNIME Analytics Platform for data-driven innovation. Participants will learn to build data science scenarios, train and validate models, and implement end-to-end data value chains through hands-on labs and practical exercises.
The 'KNIME Analytics Platform' training offers a comprehensive overview of this free data analysis platform. The programme covers an introduction to data processing and analysis, installation and configuration of KNIME, building workflows, business model creation methodology, and data modelling. The course also discusses advanced data analysis tools, workflow import and export, tool integration, ETL processes, data mining, visualization, extensions, and integrations with tools such as R, Java, Python, Gephi, and Neo4j. The conclusion includes a discussion on reporting, integration with BIRT, and KNIME WebPortal.
As participants prepare to pursue advanced Data Analytics degrees overseas, they encounter a dual challenge: mastering technical coding skills while understanding how to translate data into tangible business value. This intensive 5.5-hour program is designed to address both gaps simultaneously. By integrating Python technical foundations with an introductory business analytics framework, we ensure that your team begins their academic journey as leaders, rather than merely learners.
In Nantes, this course offers a comprehensive introduction to QGIS, focusing on spatial data analysis, map creation, and layer management. It also covers PyQGIS for advanced Python integration and plugin development, providing participants with practical GIS skills.
This instructor-led, live training in Nantes (online or onsite) is designed for individuals who want to understand requirements analysis and perform it efficiently and accurately using appropriate analysis techniques for their projects.
By the end of this training, participants will be able to:
identify various types of requirements.
understand the core concepts and activities involved in requirements analysis.
become familiar with the requirements analysis methodology.
leverage different requirements analysis techniques effectively.
structure requirements to communicate efficiently with architects and developers through an iterative requirement gathering process.
This instructor-led live training in Nantes (online or onsite) is aimed at business analysts and data analysts who wish to use TIBCO Spotfire X with its artificial intelligence capabilities to visualize, transform, and analyze data.
By the end of this training, participants will be able to:
Install and configure TIBCO Spotfire X.
Understand the features and architecture of TIBCO Spotfire X.
Understand the concepts behind augmented and predictive analytics.
Learn how to load, process, and visualize data using Spotfire X.
Create interactive and enhanced data visualizations.
This instructor-led, live training in Nantes (online or onsite) is aimed at business professionals who wish to use data storytelling, PowerPoint, and AI tools to create executive presentations that support decision-making and adhere to corporate branding standards.
By the end of this training, participants will be able to structure messages with AI, improve slide design, strengthen visual stories, and deliver clearer executive presentations.
Read more...
Last Updated:
Testimonials (16)
I finally understood the idea of the pipes and how to use R in our work context.
Katrin Groth - Senatsverwaltung fur Bildung, Jugend und Familie
Course - Data Analytics With R
the labs and the quality of the hands-on exercises
Anne-Sophie Fillioux - As international
Course - Databricks
Machine Translated
Jasperstudio can be used for pixel perfect documentation. There would be limitations as it cannot be used for reporting
Ethan Koh Ree Haur - MSIG Asia Pte Ltd
Course - JasperReports
Learning that the QGIS and a tool that can used by other different professionals such land survey
Bame Duncan Koko - Bentel Technologies (Pty) Ltd
Course - QGIS for Geographic Information System
Practical and hands on labs on report developmemt using Power BI
The labs were excellent and the trainer offered very good hands on sessions
Sinzala Sichaanji - Bank of Zambia
Course - Mastering Power Platform: Power Apps, Power Automate, DataVerse, Power BI, and Power Virtual Agents
personalised to our understanding and data
Vincent Long - ASSMANG PTY LTD
Course - Business Intelligence with SSAS
Practice in using python is really helpful to understand the basics.
Wildana Ramadhani - OJK
Course - Foundations of Data & Business Analytics
the practical part
Daniela Mirevska
Course - Business Process Modelling in BPMN 2.0
We did quite complex examples, so we could get a feeling of how the real work with Power Automate Desktop can look like in the real world scenario.
Michal Strnad - MicroNova AG
Course - Microsoft Flow/Power Automate
Smart work reporting criteria
Siyabonga Kubeka - NTCSA
Course - Power BI for Business Analysts
The teacher clarification of the teacher about the subjects
Josildo Zangue - EMIS - Empresa Interbancaria de Servicos, S.A
Course - Business Analysis
hands on exercise
shuzhen hong
Course - AI-Driven Data Analysis with TIBCO Spotfire X
What I like the most about the training was the detailed discussion and the Exercises.
Kevin Roi Rimpos - Century Pacific Food Inc.
Course - Business Process Re-engineering for Competitive Advantage
It felt very well paced and Yashank was a great trainer!
Rebekah Kane - OVO
Course - Mixpanel
The trainer shared his knowledge and led great atmosphere.
Agnieszka Dubanska - Narodowy Fundusz Zdrowia
Course - Modelowanie procesów biznesowych z wykorzystaniem UML i BPMN
information about report, kind of costs, details about that in accounting
Konrad Nowak - Solvti Sp. z o. o.
Course - Business Intelligence Reporting Tool (BIRT)
Online Data Analysis training in Nantes, Data Analysis training courses in Nantes, Weekend Data Analysis courses in Nantes, Evening Data Analysis training in Nantes, Data Analysis instructor-led in Nantes, Evening Data Analysis courses in Nantes, Data Analysis instructor-led in Nantes, Data Analysis private courses in Nantes, Data Analysis coaching in Nantes, Data Analysis boot camp in Nantes, Data Analysis one on one training in Nantes, Data Analysis trainer in Nantes, Online Data Analysis training in Nantes, Data Analysis on-site in Nantes, Data Analysis instructor in Nantes, Data Analysis classes in Nantes, Weekend Data Analysis training in Nantes